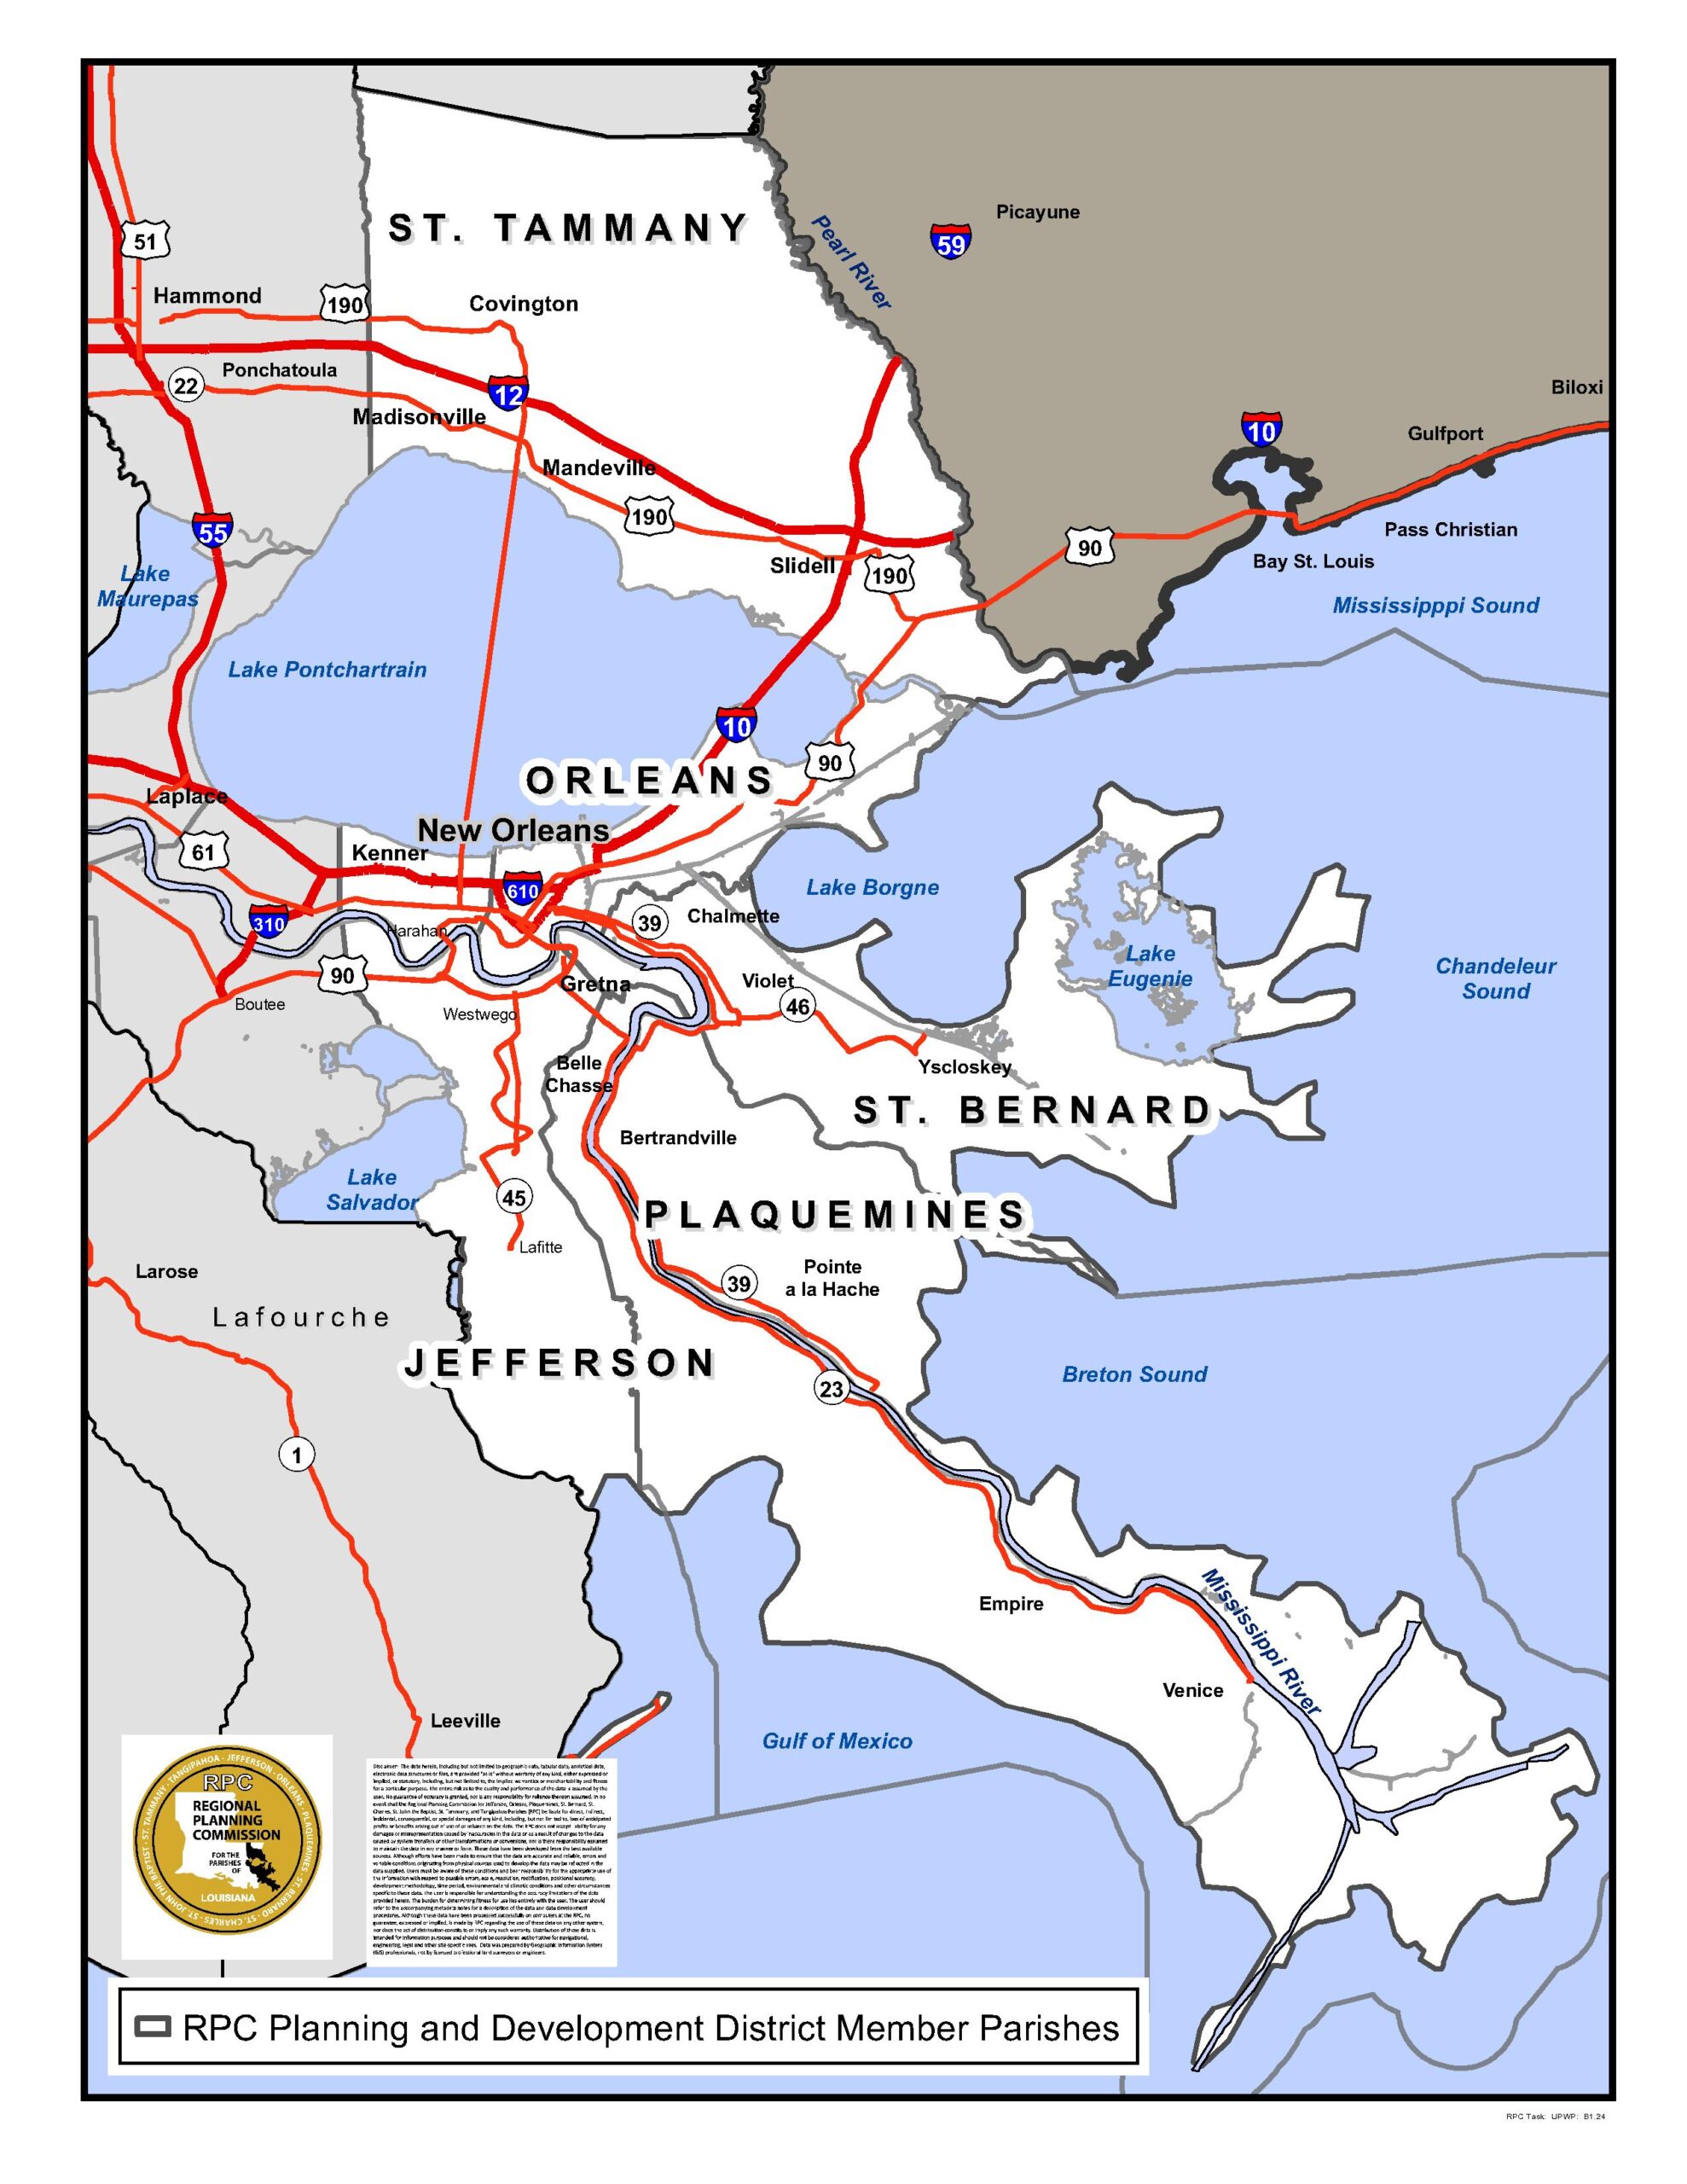
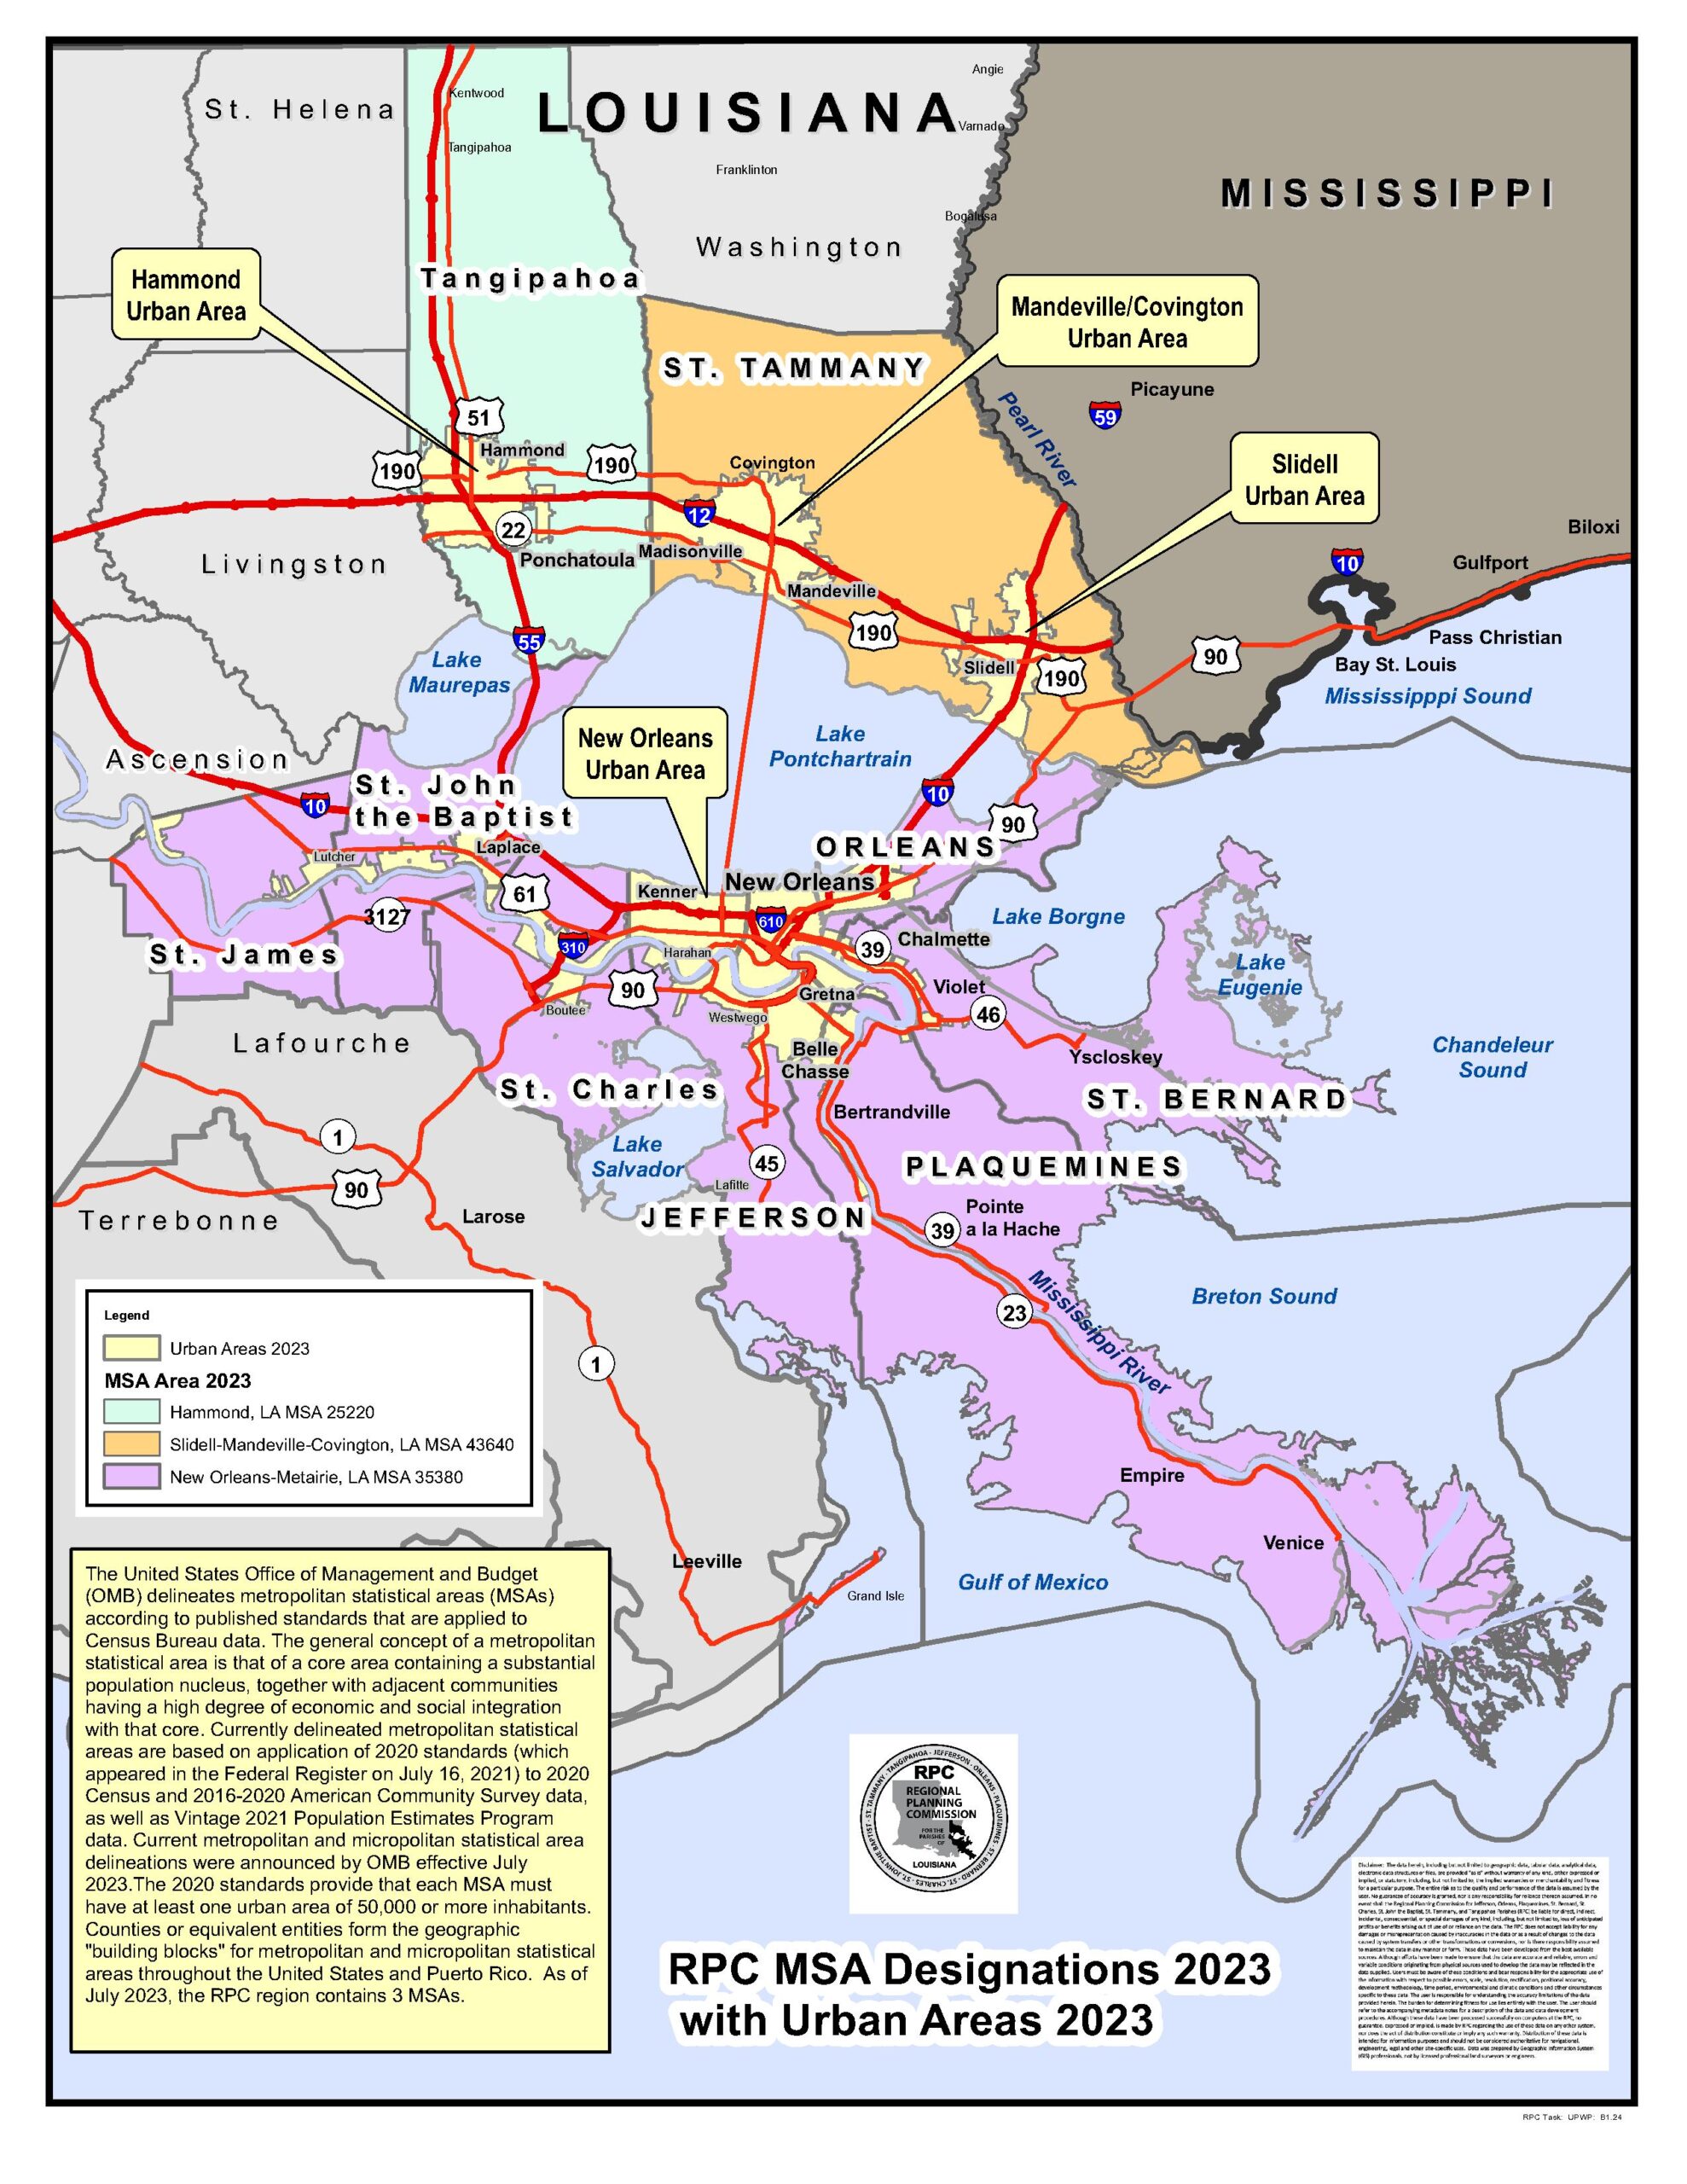
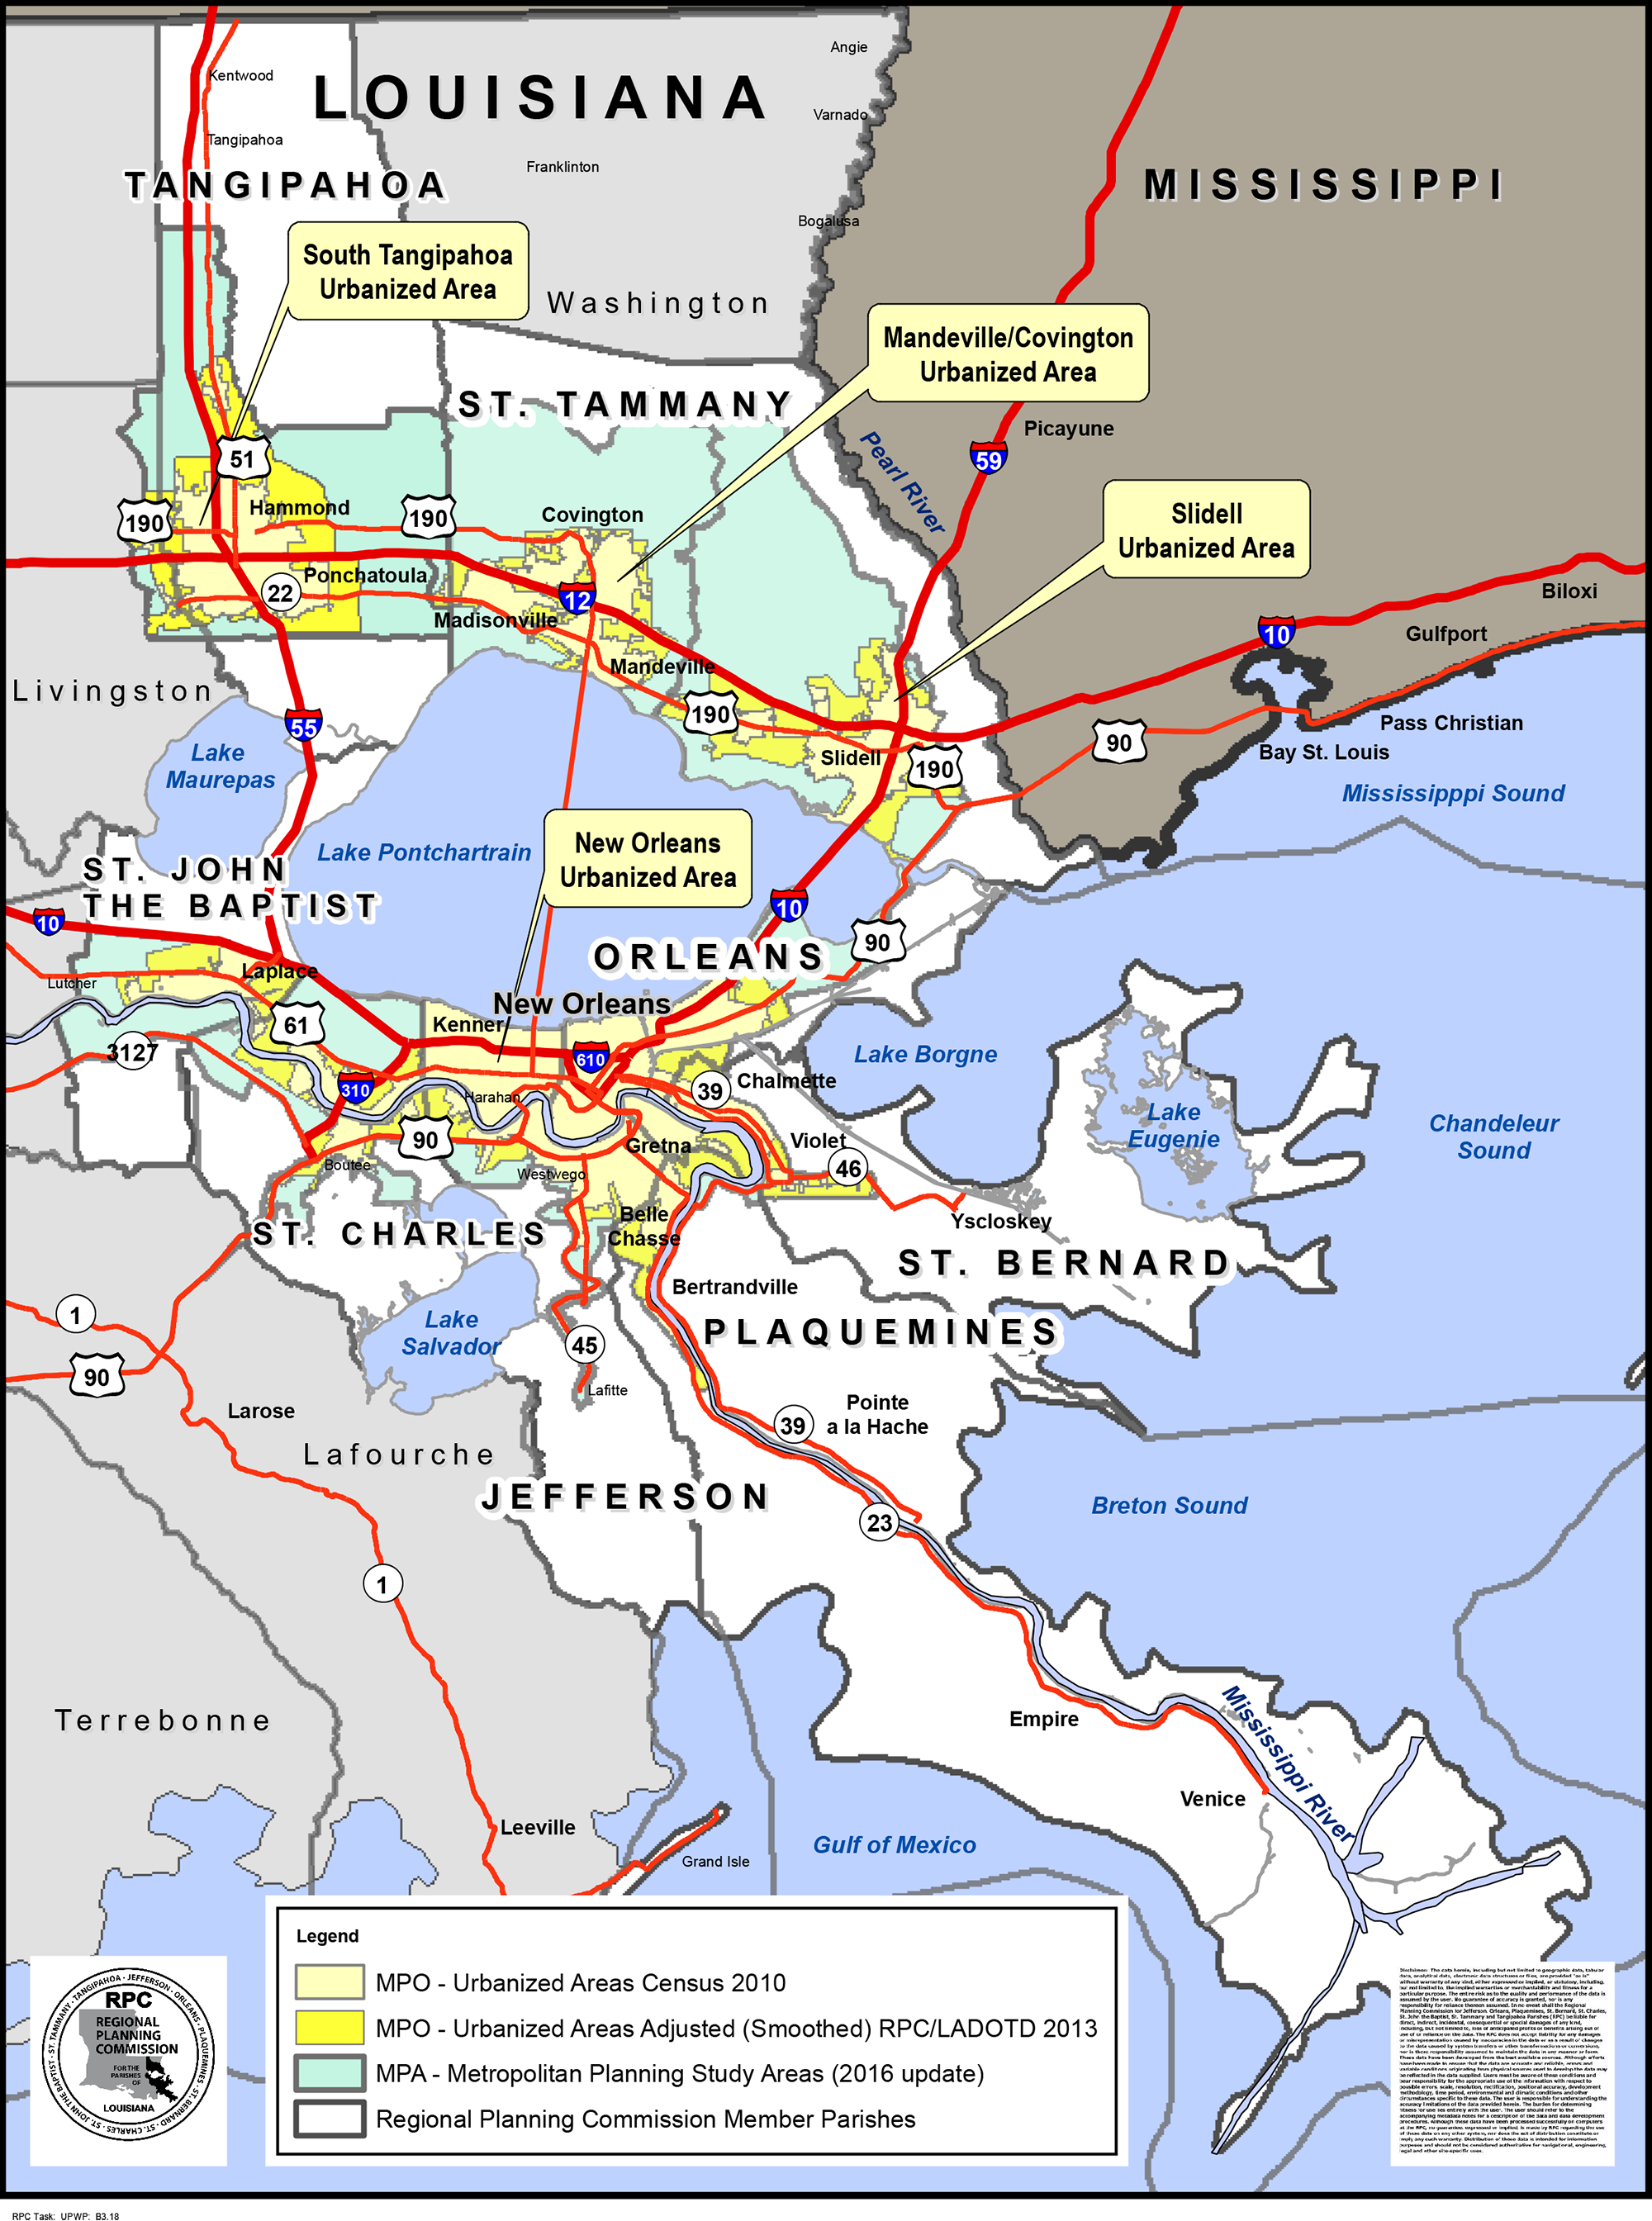
Demographics
The region’s population has experienced significant changes during the last 50 years. Population increased dramatically during the 1960s and 1970s, primarily due to the growth of the oil and gas industry. Then, in the early 1980s the region encountered a significant decline in population, attributed to the oil bust. Prior to Hurricanes Katrina and Rita, in 2005, the region maintained a population of approximately 1.3 million. Katrina and Rita amplified pre-existing shifts in population: Orleans, Plaquemines and St. Bernard parishes endured dramatic population losses, whereas St. Charles, St. John and St. Tammany parishes gained residents. The current population of the region is approximately 1.2 million.
 |
|
 |
|
Total Population for the Greater New Orleans Region* |
|
|
|
| Parish |
Population – 2000 Census |
Population -- 2010 Census
|
| Jefferson |
455,466 |
443,522 |
| Orleans |
484,674 |
348,829 |
| Plaquemines |
26,757 |
23,042 |
| St. Charles |
48,072 |
52,780 |
| St. Bernard |
67,229 |
35,897 |
| St. John the Baptist |
43,044 |
45,924 |
| St. Tammany |
191,258 |
233,740 |
| Total |
1,316,500 |
1,172,734 |
| |
*The above figures show the comparison between the 2000 and 2010 official U.S. Census population figures for parishes in the New Orleans region.
Prepared by the Regional Planning Commission for Jefferson, Orleans, Plaquemines, St. Bernard and St. Tammany Parishes |
|
|
 |
|
 |
RPC Census Maps
To assist local government agencies, the business community, schools, community organizations and the general public in the utilization of data from the US Department of the Census, our staff has generated a Census Tracts Map Series that provides coverage of our member-parishes. Every effort has been made to produce accurate maps. However, these are not official US Census maps and as such may not be used for legal or official purposes. The maps are designed to print on 11” x17” paper.
Additional information about the region’s demographic composition can be found at the U.S. Census Bureau. |